Reducing delivery costs through intelligent route optimization
On-Road Integrated Optimization and Navigation evaluates routing choices at a scale that manual planning cannot practically match. Its original documented technology is primarily operations research and prescriptive analytics, making this an intelligent optimization case rather than a generative AI case. Reported outcomes. The customer reported achieving an annual reduction of 100 million miles driven. Investment impact. Using the historical $250 million investment estimate and $300–400 million annual savings range: 1. Annual savings ÷ investment: 1.2–1.6 times 2. Simple payback at full operating scale: 7.5–10 months 3. One full year’s savings minus investment, divided by investment: 20–60%
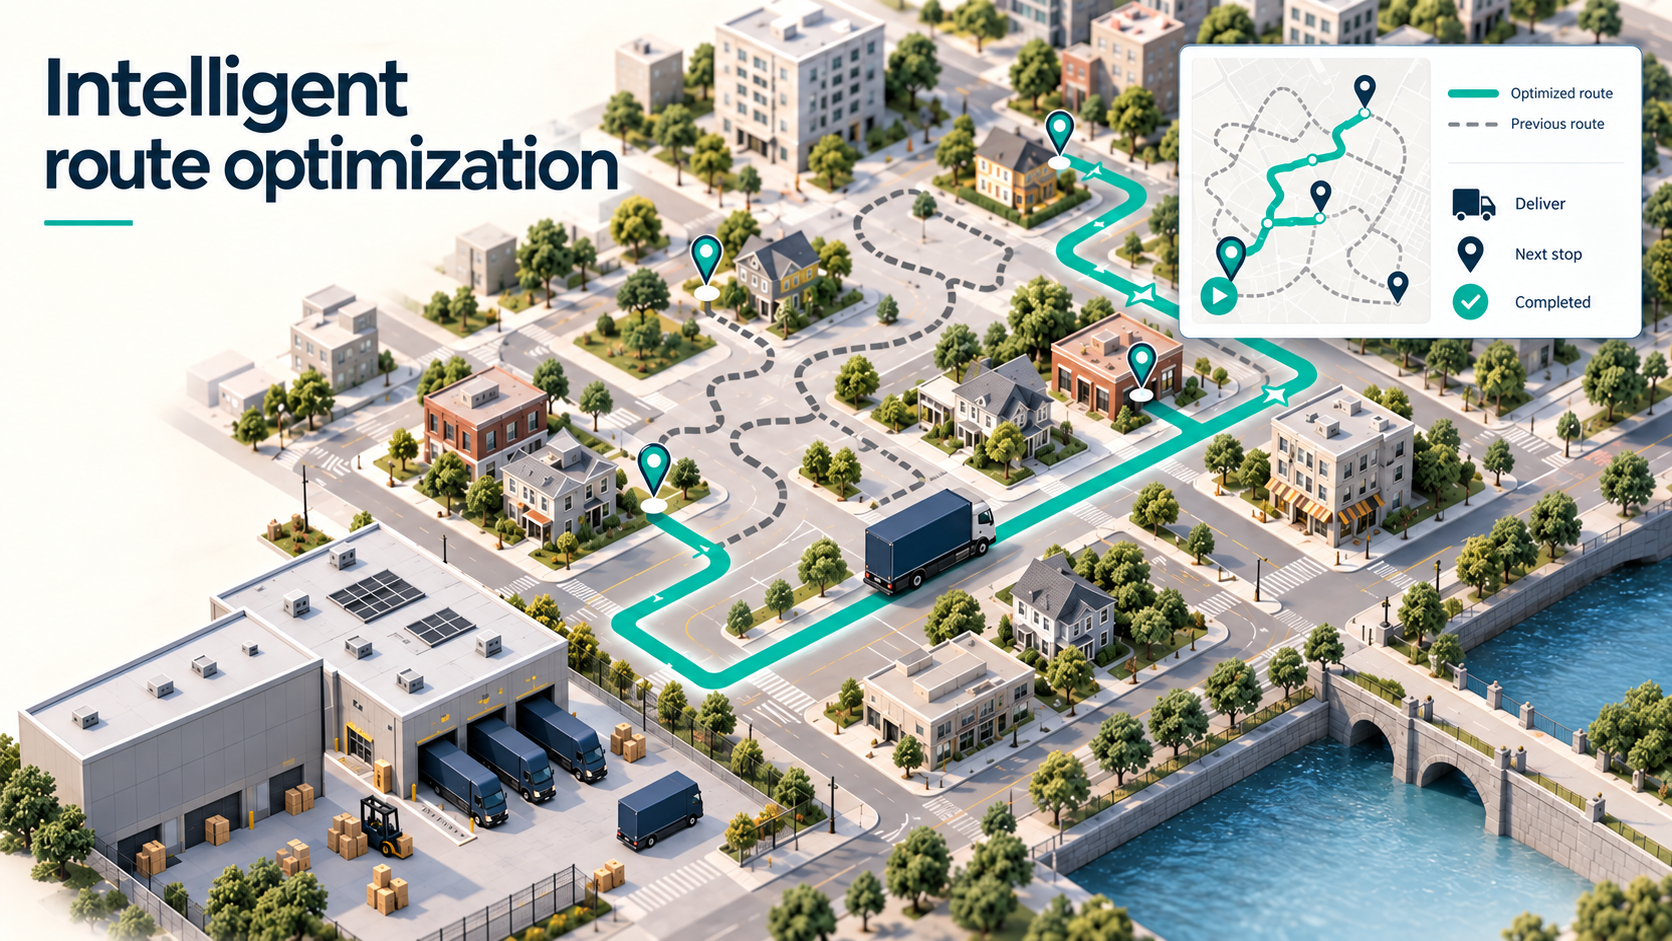
What was breaking.
The customer needed to serve large numbers of delivery and pickup locations while meeting service commitments. Small inefficiencies in each driver’s route accumulated into substantial fuel consumption, driving time, and vehicle costs.
What we built.
We developed On-Road Integrated Optimization and Navigation. The system combines package information, customized maps, vehicle telematics, and optimization algorithms to determine efficient delivery sequences. Customer tested the system in the field before expanding deployment, completing rollout to its targeted US routes. Driver knowledge remained part of effective implementation.
What changed.
On-Road Integrated Optimization and Navigation evaluates routing choices at a scale that manual planning cannot practically match. Its original documented technology is primarily operations research and prescriptive analytics, making this an intelligent optimization case rather than a generative AI case.
Reported outcomes.
The customer reported achieving an annual reduction of 100 million miles driven.
Investment impact. Using the historical $250 million investment estimate and $300–400 million annual savings range: 1. Annual savings ÷ investment: 1.2–1.6 times
2. Simple payback at full operating scale: 7.5–10 months
3. One full year’s savings minus investment, divided by investment: 20–60%